Google’s new AI Performance Reports in Search Console are an important step in understanding how content is appearing in AI-powered search experiences. But marketers quickly learn that these reports provide only a partial view of Generative Engine Optimization (GEO) performance.
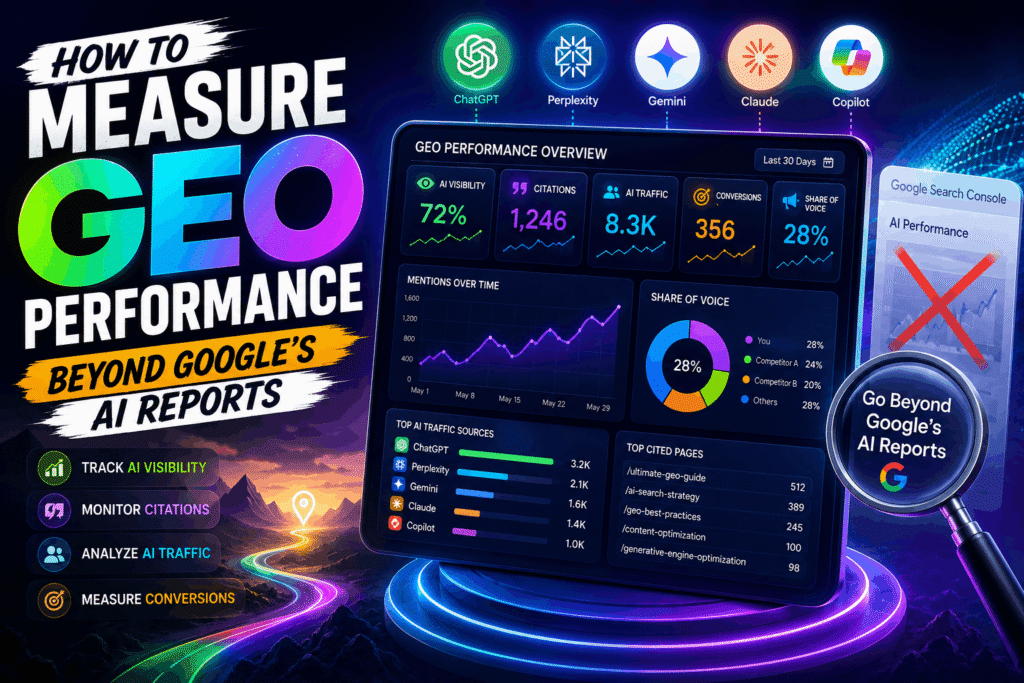
The problem is simple: Google Search Console can only report what happens within Google’s ecosystem. You don’t know how many times you are cited by Perplexity, how many times your brand is mentioned by Gemini, how many times your expertise is mentioned by Claude or by ChatGPT.
This indicates marketers who are only looking at Search Console may be underestimating their actual visibility in AI search.
In this guide, you’ll learn how to measure GEO performance with a comprehensive framework that goes beyond what Google’s new AI reporting can do.
How to Measure GEO Performance: What Google’s AI Reports Actually Show
Google’s AI Performance Reports give visibility into:
| Metric | What It Measures |
| Clicks | Traffic generated from AI-powered search experiences |
| Impressions | How often content appears in AI experiences |
| CTR | Click-through rate from AI experiences |
| Position | Average ranking position |
These metrics are used to measure AI search visibility in Google Search.
But they do not measure:
ChatGPT citations
Perplexity references
Gemini visibility
Claude mentions
Brand inclusion in AI-generated answers
Share of voice across LLMs
This is why marketers need other systems to measure GEO.
How to Measure GEO Performance Beyond Google Search Console
Traditional SEO reports are all about rankings and organic traffic.
The performance of GEO should be measured by a wider range of indicators.
A modern GEO framework should be judged by:
| GEO Area | KPI |
| AI Visibility | Brand mentions in AI answers |
| Citation Frequency | Number of source citations |
| LLM Traffic | Visits from AI platforms |
| Share of Voice | Competitor comparison |
| Conversion Impact | Leads and revenue generated |
| Entity Recognition | Brand understanding by AI models |
The goal is no longer simply to be on page one.
The aim is to become the AI that other AIs turn to and quote.
How to Measure GEO Performance Through AI Referral Traffic
Referral traffic is one of the easiest ways to measure GEO performance.
Many AI platforms are passing referral data now.
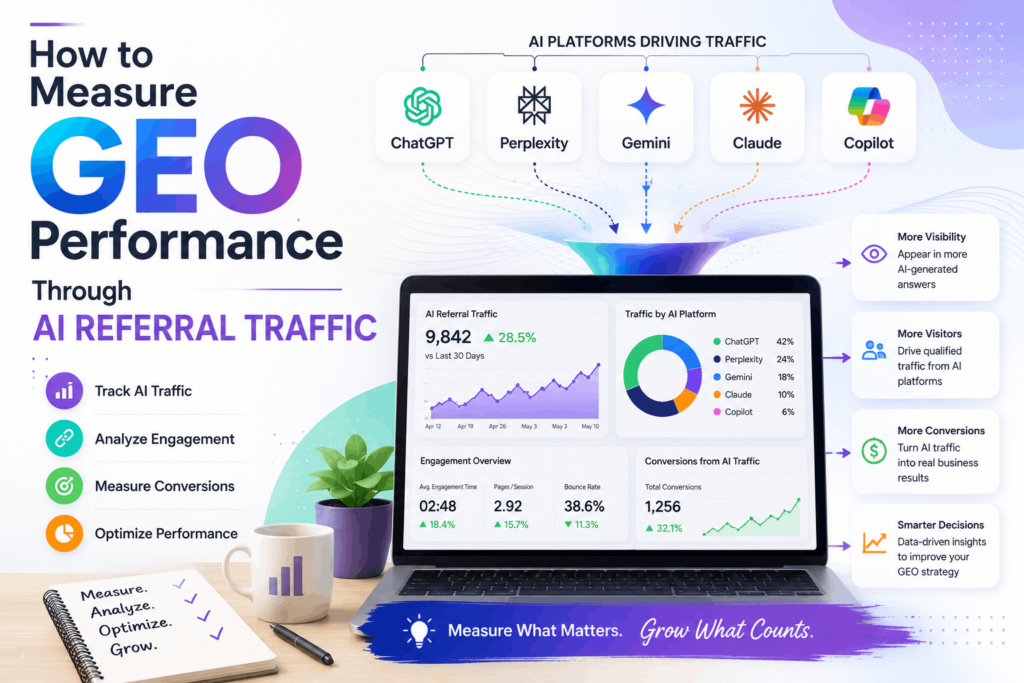
For instance:
| AI Platform | Referral Visibility |
| ChatGPT | Often visible |
| Perplexity | Visible |
| Gemini | Limited visibility |
| Claude | Growing visibility |
| Copilot | Partial visibility |
In GA4, navigate to:
Acquisition >>>> Traffic Acquisition
Then filter sources such as:
- chatgpt.com
- perplexity.ai
- gemini.google.com
- claude.ai
- copilot.microsoft.com
Example:
Imagine a website receives:
| Source | Monthly Visits |
| Google Organic | 15,000 |
| ChatGPT | 850 |
| Perplexity | 430 |
| Gemini | 220 |
| Claude | 150 |
The site gets 1,650 visits from AI search ecosystems.
That’s not the complete picture you’d get from Google Search Console alone.
How to Measure GEO Performance Using Citation Tracking
Citations are the backlinks of AI search.
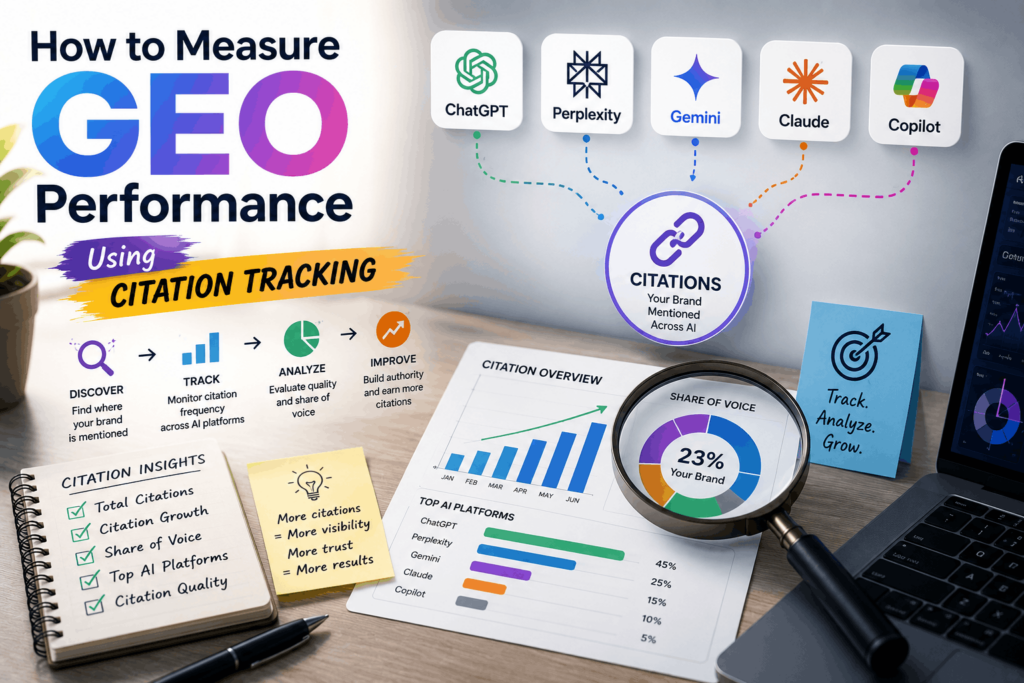
Citing your content repeatedly is a mark of trust and authority for AI systems.
Example Prompt:
“What are the best GEO tools in 2026?”
Possible AI response:
- Brand A
- Brand B
- Your Brand
This mention turns into a measurable GEO asset.
Track:
| Citation Metric | Description |
| Citation Count | Total references |
| Citation Growth | Monthly increase |
| Citation Share | Competitive comparison |
| Source Diversity | Number of AI platforms citing you |
Example:
| Brand | Monthly Citations |
| Competitor A | 55 |
| Competitor B | 42 |
| Your Brand | 28 |
This provides direct evidence of GEO visibility.
How to Measure GEO Performance Through Share of Voice
Share of Voice (SOV) is now one of the biggest GEO performance metrics.
Say marketers test out 100 prompts related to their industry.
Results:
| Brand | Mentions |
| Brand A | 38 |
| Brand B | 27 |
| Your Brand | 21 |
| Others | 14 |
Your share of voice
21%
This metric commonly precedes traffic increases to show GEO progress.
Many brands see a spike in AI mentions and citations before referral traffic begins to grow.
How to Measure GEO Performance Through Entity Recognition
Large Language Models work a lot on entities rather than keywords .
An entity can be:
- Brand
- Person
- Product
- Service
- Organization
Example:
If someone asks:
“Who are the leading GEO consultants?”
An AI model can identify entities like:
- Industry experts
- Agencies
- Consultants
The more consistent your entity is across authoritative sources, the better your GEO performance.
Track:
| Entity Signal | Importance |
| Brand Mentions | High |
| Expert Mentions | High |
| Author Citations | High |
| Knowledge Graph Presence | Medium |
| Industry Listings | Medium |
How to Measure GEO Performance Through Conversion Metrics
Success is not just about traffic.
Business impact is the most important GEO metric.
Measure:
| Conversion KPI | Example |
| Leads | Demo requests |
| Revenue | Sales generated |
| Signups | Newsletter subscriptions |
| Bookings | Consultation calls |
| Pipeline Value | Closed-won opportunities |
Example:
| Source | Traffic | Leads |
| 15,000 | 120 | |
| ChatGPT | 850 | 25 |
| Perplexity | 430 | 11 |
“Conversion rates could be a lot higher, even though the volume of AI traffic is lower.”
This shows the importance of GEO measurement to go beyond visibility metrics.
How to Measure GEO Performance With a GEO Dashboard
A GEO dashboard should consolidate data from multiple sources.
Proposed dashboard components:
| Section | Metrics |
| AI Traffic | Sessions, Users |
| Citations | Monthly Mentions |
| Share of Voice | Brand Visibility |
| Conversions | Leads, Revenue |
| Entity Signals | Brand Recognition |
| Competitor Tracking | Citation Comparison |
Tools commonly used:
- GA4
- Looker Studio
- Ahrefs
- Semrush
- Brand Monitoring Platforms
- Citation Tracking Systems
The centralized dashboard provides continuous GEO reporting.
How to Measure GEO Performance: A Practical Example
Consider two companies.
Company A:
- Tracks rankings
- Tracks impressions
- Tracks clicks
Company B:
- Tracks AI traffic
- Tracks citations
- Tracks share of voice
- Tracks entity recognition
- Tracks revenue impact
After six months:
| Metric | Company A | Company B |
| Organic Traffic | Improved | |
| AI Traffic | Unknown | Tracked |
| Citations | Unknown | Tracked |
| Revenue Attribution | Unknown | Tracked |
| GEO Visibility | Unknown | Measured |
Company B gets a lot more insight into actual GEO effectiveness.
How to Measure GEO Performance in 2026: The Future of GEO Analytics
A new measurement challenge is being created by the evolution of search.
Google’s AI Performance Reports are great but are just one layer of GEO analytics.
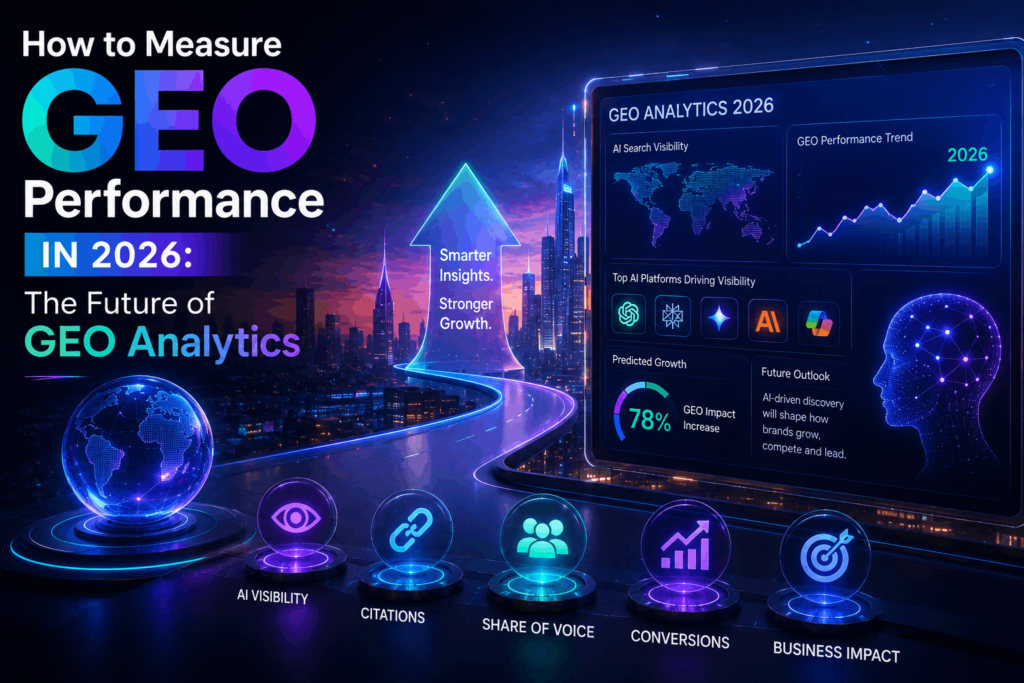
Future GEO reporting will be increasingly directed towards:
- AI citation frequency
- LLM visibility
- Share of voice
- Entity recognition
- Referral traffic
- Conversion attribution
The winners in AI search will be the brands that invest in measurement systems that can measure visibility across the entire generative search ecosystem, not within a single platform.
Knowing how to measure GEO performance is not optional anymore. As AI-driven search grows, marketers who rely solely on Google Search Console risk missing out on crucial insights about how their content performs on ChatGPT, Perplexity, Gemini, Claude, and future generative search platforms.
A full GEO measurement framework includes AI traffic, citation monitoring, entity tracking, share of voice analysis and business outcomes. Combined, these measures provide a far more accurate picture of AI search success than rankings and clicks alone.